School Counselor Salary in Ohio: $61,248 (2026)
Quick Answer:Across Ohio's 67 metropolitan areas, the average median school counselor pay sits at $61,248/year heading into 2026 — a figure projected from 2025 BLS OEWS wage data for SOC 21-1012. Because Ohio sits at BEA RPP 90.7 (9% below the U.S. baseline), that statewide median translates to roughly $67,528 in nationally-comparable purchasing power. Highest-paying metros: Sandusky ($64,670), Canton ($62,201), Massillon ($61,358).
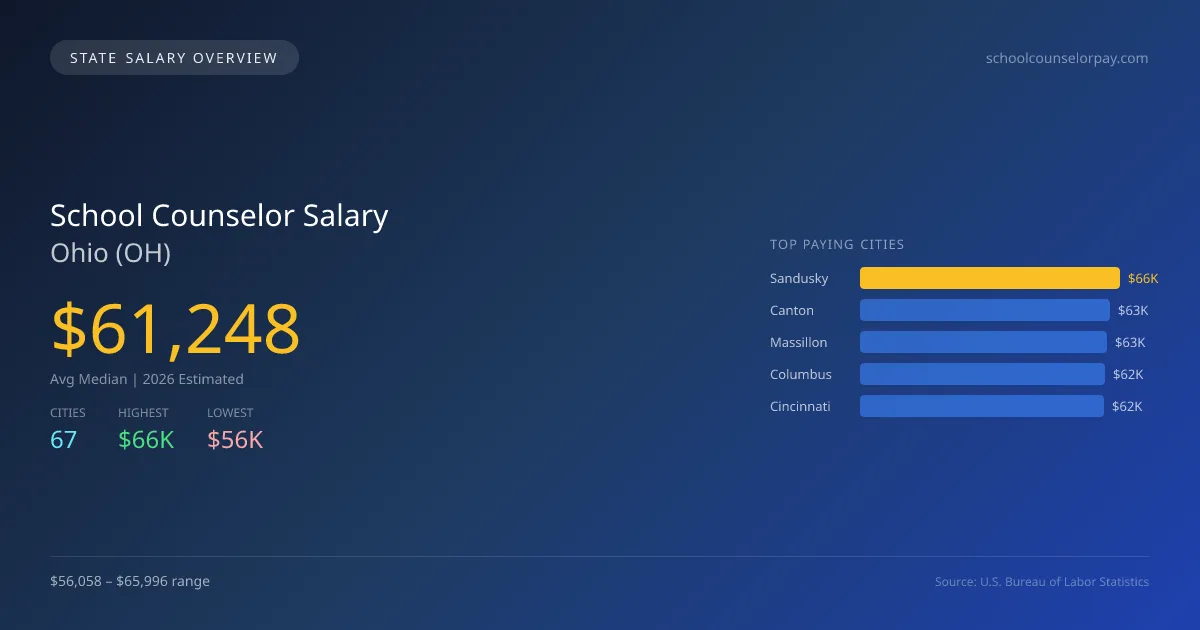
In Ohio, the average median salary for school counselors in 2026 is projected at $61,247, which reflects a 4.8% decrease compared to the national median salary of $64,335. This discrepancy highlights a regional pay gap that can be influenced by various factors, including cost of living differences and funding for education. The highest-paying city for school counselors in Ohio is Sandusky, with a projected salary of $65,996, while Solon ranks as the lowest at $56,058, resulting in a salary gap of $9,938 between these two cities. Factors driving this difference may include local education budgets, demand for counselors, and the varying scope of practice laws across the state. Ohio school counselors must navigate state licensing requirements, which include obtaining a Master’s degree in counseling and passing relevant examinations. The job market shows a positive outlook with a projected annual growth rate of 2.05%, indicating steady demand for professionals in this field. Top cities for employment in 2026, alongside Sandusky, include Canton at $63,476, Massillon at $62,616, Columbus at $62,085, and Cincinnati at $61,835. The overall employment of school counselors in Ohio is projected at 11,777, delineating a critical role in supporting the educational landscape.
Ohio School Counselor Salary Range
Overall salary range in Ohio: $38,583 (lowest entry-level) to $106,620 (highest top earner)
Ohio vs National Average
Ohio school counselors earn 4.8% less than the national median ($-3,087/year difference).
Ohio School Counselor Salary Distribution (2026)
School Counselor salaries in Ohio range from $43,792 (entry-level, 10th percentile) to $99,553 (top earners, 90th percentile), with a median of $61,248. The Ohio median is $3,087 below the US national median of $64,335. The average hourly rate is $29.45/hr. Approximately 11,777 school counselors are employed across 67 cities.
2019 BLS Actual
$53,941
2025 BLS Actual
$60,017
2026 Current Est.
$61,248
2019–2027 Growth
+15.9%
Salary Trajectory for School Counselors in Ohio (2019–2027)
2019–2025: actual BLS OEWS data for this metro area. 2026+: CAGR 2.05% projection.
| Year | Annual Salary | Status |
|---|---|---|
| 2019 | $53,941 | Actual |
| 2020 | $54,087 | Actual |
| 2021 | $60,382 | Actual |
| 2022 | $67,444 | Actual |
| 2023 | $64,445 | Actual |
| 2024 | $62,623 | Actual |
| 2025 | $60,017 | Actual |
| 2026(current) | $61,248 | Estimated |
| 2027 | $62,503 | Projected |
Based on 7 years of BLS OEWS data for the Ohio metropolitan area, the median school counselor salary grew 11.3% from $53,941 (2019) to $60,017 (2025). At a 2.05% compound annual growth rate, salaries are projected to reach $62,503 by 2027 — a total increase of $8,562 (15.87%) from 2019.
Note: Historical values (2019–2025) are actual BLS OEWS figures for the Ohio metropolitan area, sourced from annual Occupational Employment and Wage Statistics surveys. 2026–2026 figures are current estimates, and 2027 values are projections, calculated using a 2.05% CAGR derived from 7-year BLS historical data. Actual salaries may vary based on employer, experience, certifications, and local market conditions.
Top 5 Highest Paying Cities in Ohio
Lowest Paying Cities in Ohio
| City | Median Salary |
|---|---|
| Solon | $56,058 |
| Centerville | $56,067 |
| Avon Lake | $56,191 |
| Wadsworth | $56,233 |
| Tiffin | $56,279 |
Best Value Cities for School Counselors in Ohio
When adjusted for local cost of living, these Ohio cities offer the most purchasing power for school counselors.
| City | Nominal Salary | CoL Index | Adjusted Salary |
|---|---|---|---|
| Sandusky | $65,996 | 89.281 | $73,919 |
| Canton | $63,476 | 89.406 | $70,997 |
| Massillon | $62,616 | 90.7 | $69,036 |
| Lorain | $61,654 | 90.7 | $67,976 |
| Parma | $61,484 | 90.7 | $67,788 |
Adjusted salary = nominal salary × (100 / CoL index). CoL index: 100 = national average. Lower index = lower cost of living.
Salary by Experience Level in Ohio
| Experience Level | Estimated Annual |
|---|---|
| Entry Level (0-2 years) | $43,792 |
| Mid Career (3-7 years) | $61,248 |
| Experienced (7+ years) | $99,553 |
Estimates based on BLS percentile data averaged across Ohio metro areas. Individual pay varies by employer, certifications, and specialization.
All 67 Cities in Ohio
| # | City | Median Salary |
|---|---|---|
| 1 | Sandusky | $65,996 |
| 2 | Canton | $63,476 |
| 3 | Massillon | $62,616 |
| 4 | Columbus | $62,085 |
| 5 | Cincinnati | $61,835 |
| 6 | Lorain | $61,654 |
| 7 | Cleveland | $61,626 |
| 8 | Parma | $61,484 |
| 9 | Akron | $61,335 |
| 10 | Cuyahoga Falls | $61,233 |
| 11 | Hamilton | $61,021 |
| 12 | Beavercreek | $60,750 |
| 13 | Lakewood | $60,687 |
| 14 | Dayton | $60,655 |
| 15 | Bowling Green | $60,606 |
| 16 | Lancaster | $60,588 |
| 17 | Zanesville | $60,583 |
| 18 | Westlake | $60,479 |
| 19 | Middletown | $60,455 |
| 20 | Grove City | $60,280 |
| 21 | Delaware | $60,233 |
| 22 | Gahanna | $60,224 |
| 23 | Westerville | $60,185 |
| 24 | Huber Heights | $60,043 |
| 25 | North Ridgeville | $59,996 |
| 26 | North Royalton | $59,910 |
| 27 | Kettering | $59,838 |
| 28 | Lima | $59,795 |
| 29 | North Olmsted | $59,698 |
| 30 | Reynoldsburg | $59,594 |
| 31 | Strongsville | $59,395 |
| 32 | Warren | $59,330 |
| 33 | Youngstown | $59,185 |
| 34 | Brunswick | $59,026 |
| 35 | Wooster | $59,026 |
| 36 | Elyria | $58,934 |
| 37 | Shaker Heights | $58,814 |
| 38 | Toledo | $58,776 |
| 39 | Medina | $58,775 |
| 40 | Dublin | $58,586 |
| 41 | Fairfield | $58,581 |
| 42 | Mentor | $58,520 |
| 43 | Mason | $58,263 |
| 44 | Avon | $58,191 |
| 45 | Marion | $58,103 |
| 46 | Stow | $58,098 |
| 47 | Newark | $58,065 |
| 48 | Mansfield | $58,055 |
| 49 | Findlay | $58,003 |
| 50 | Green | $57,913 |
| 51 | Barberton | $57,913 |
| 52 | Austintown | $57,890 |
| 53 | Cleveland Heights | $57,881 |
| 54 | Upper Arlington | $57,804 |
| 55 | Xenia | $57,804 |
| 56 | Hilliard | $57,734 |
| 57 | Oxford | $57,553 |
| 58 | Chillicothe | $57,430 |
| 59 | Perrysburg | $57,218 |
| 60 | Trotwood | $57,200 |
| 61 | Athens | $56,595 |
| 62 | Springfield | $56,375 |
| 63 | Tiffin | $56,279 |
| 64 | Wadsworth | $56,233 |
| 65 | Avon Lake | $56,191 |
| 66 | Centerville | $56,067 |
| 67 | Solon | $56,058 |
More Ohio Salary Data
Senior / Experienced
Top earner salaries for experienced school counselors.
Compare Cities in Ohio
View all comparisons →Explore More School Counselor Salary Data
Frequently Asked Questions
How much do school counselors make in Ohio in 2026?
What is the highest paying city for school counselors in Ohio?
How does Ohio school counselor pay compare to the national average?
What is the entry-level school counselor salary in Ohio?
How many school counselors are employed in Ohio?
Which Ohio city offers the best value for school counselors?
Written by Maria Gonzalez, M.Ed.
Content Lead
Maria has over 10 years of experience in school counseling. She specializes in academic and emotional support for high school students. She works at a public high school in California.
Methodology & Data Source
Statewide salary figures on this page are 2026 projections based on the Bureau of Labor Statistics Occupational Employment and Wage Statistics (OEWS) survey, May 2026 release. A 2.05% compound annual growth rate (CAGR), derived from 6-year national BLS wage trends, was applied to each metro area's reported salary to estimate current 2026 school counselor compensation across Ohio. State averages are employment-weighted across 67 metro areas — larger metro areas with more school counselorscontribute proportionally more to the average, producing figures that better reflect typical compensation. Individual pay varies by city, employer, certifications, and experience.
Data Sources & Methodology
Source: BLS, OEWS, 7-year dataset (–). Per-city data from annual BLS metropolitan area surveys.
2026 figures are projected from 2025 BLS data using a compound annual growth rate (CAGR) of 2.05%, derived from historical BLS wage trends for school counselors (SOC 21-1012).
Compiled and verified by Maria Gonzalez, M.Ed., a licensed school counselor with 10+ years of clinical experience. · View source data at BLS.gov